How it works

If you can see it, we can measure it.

FloVision works in four steps — process, detection, decision, and control. Here's what each one does on your floor.

The system

From your existing line to a better shift report — in four steps.
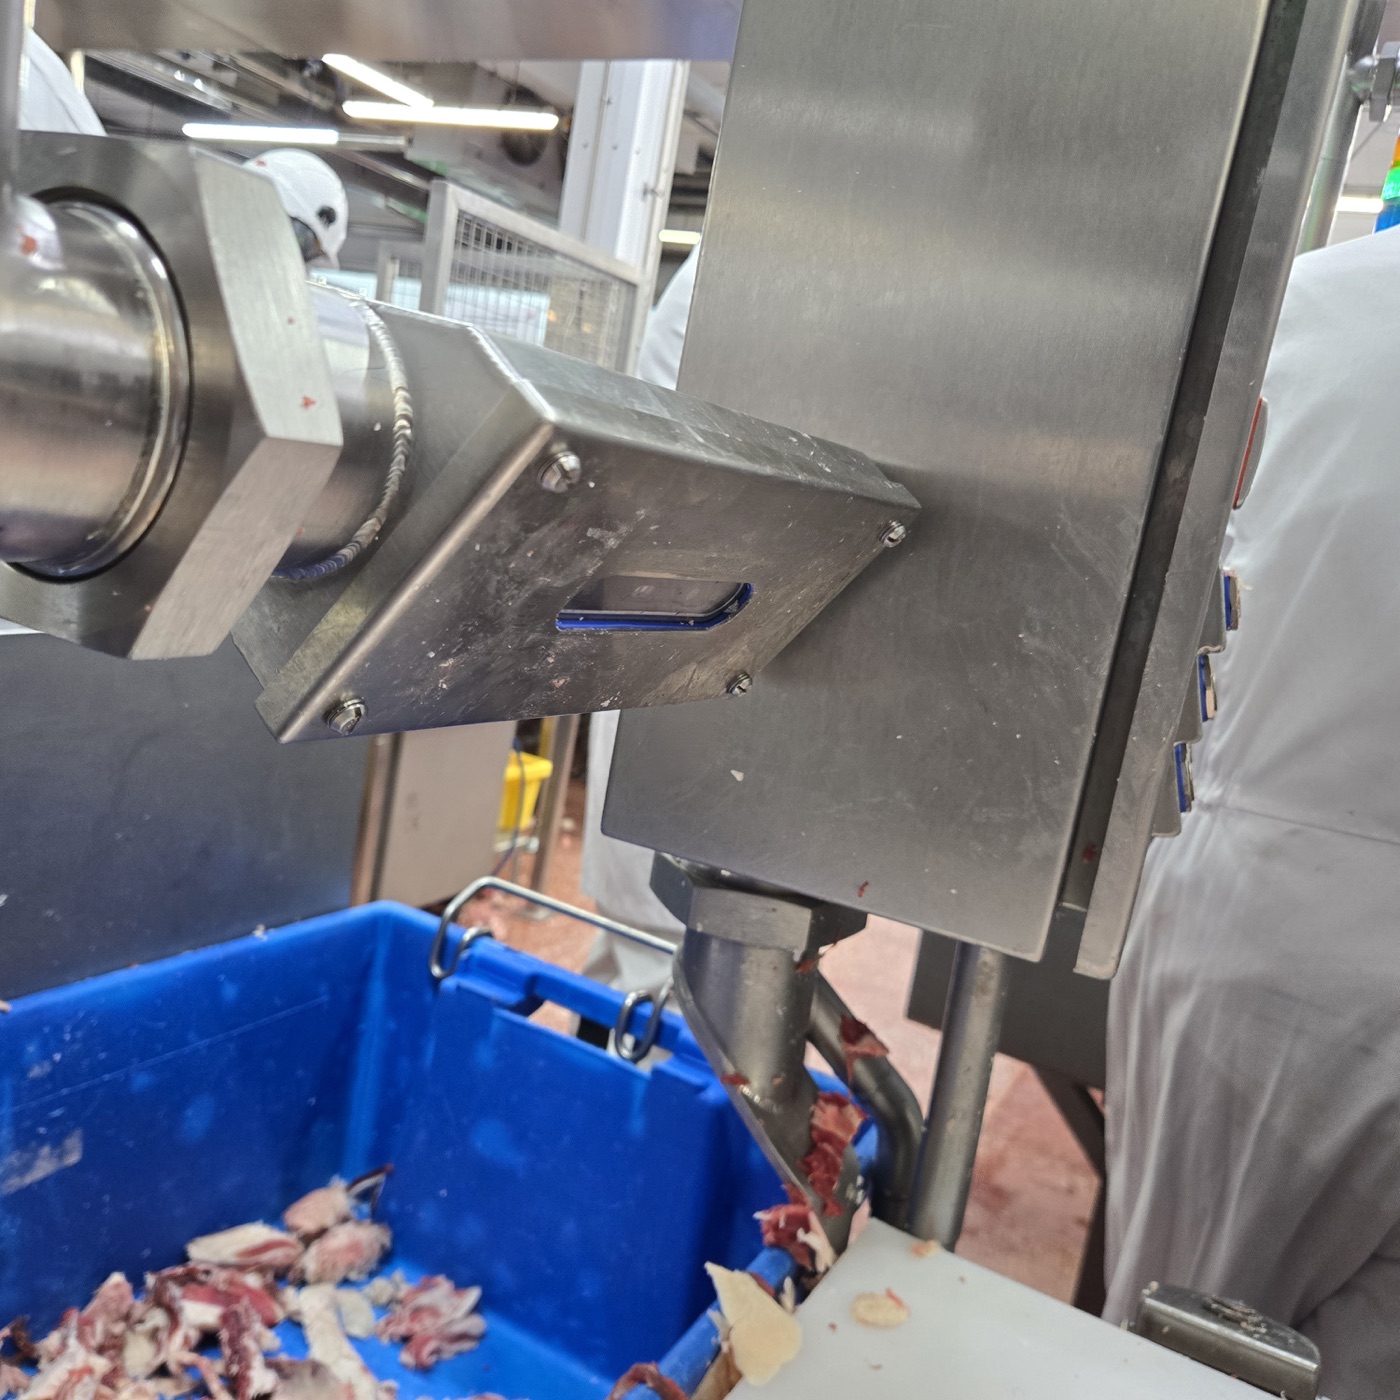
A FloVision sensor unit mounted on an existing grinder discharge over a product bin
Process

Retrofit onto your line

We retrofit your line — no new conveyors, no shutdowns. IP69K-rated sensors mount onto your existing conveyors and processing stations, tailored to your setup; we work around your line, not the other way around.
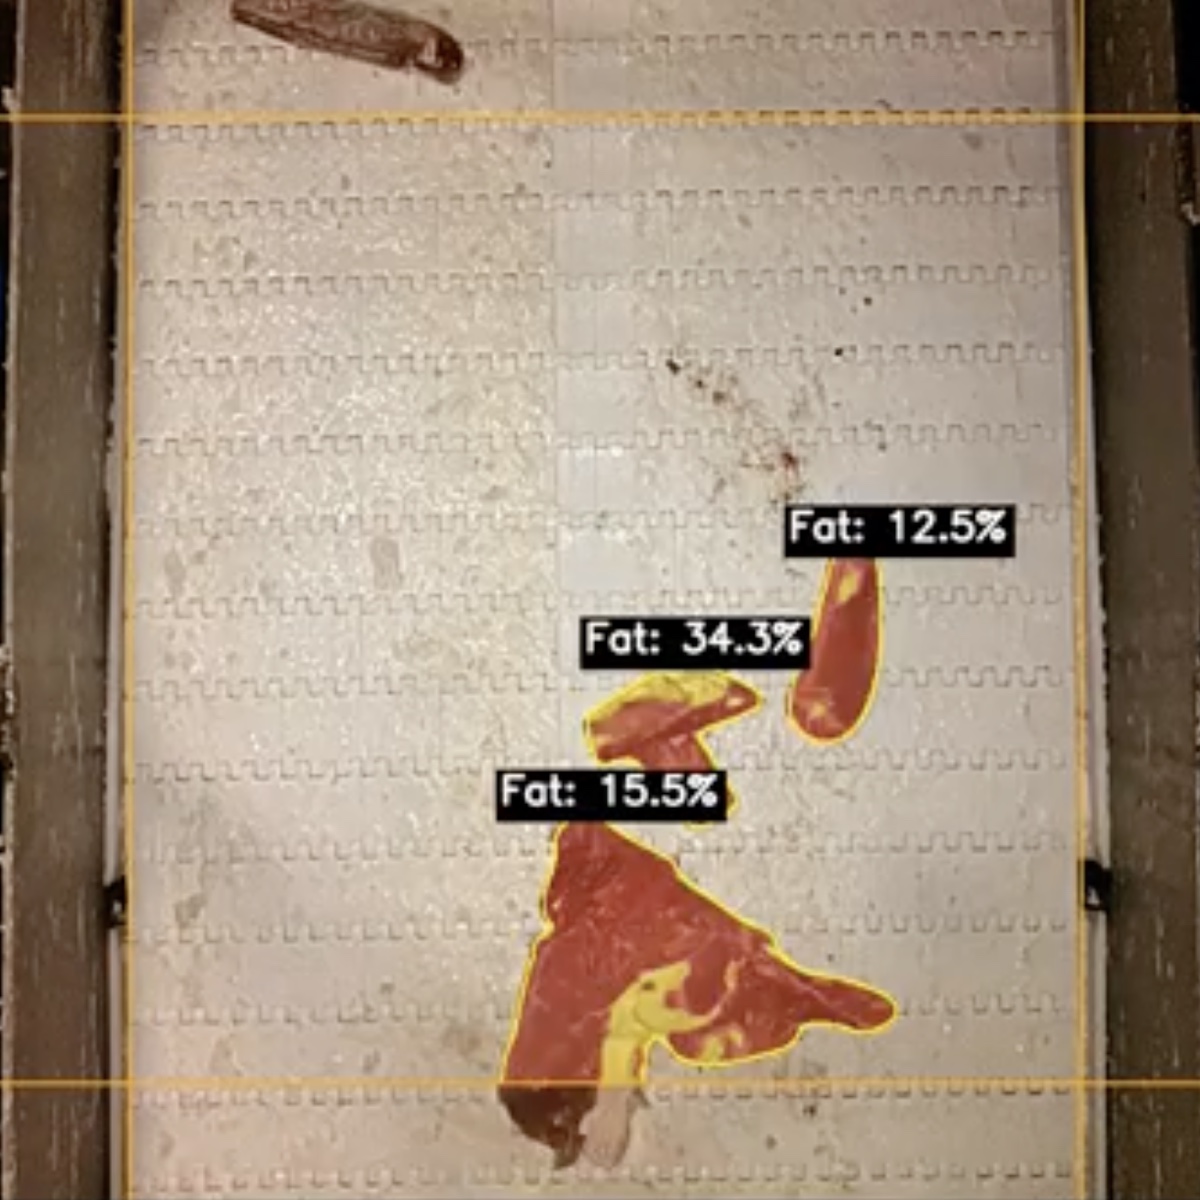
FloVision computer vision measuring the fat percentage of beef trim on a conveyor
Detection

Inspect every piece, frame by frame

Computer vision and machine learning, trained on your protein, cuts, and defects, inspect every piece on the line. FloVision counts, classifies, and measures each one — flagging foreign bodies and capturing what drives yield and meets spec.
FloVision analytics dashboard with an automated daily report email
Decision

Act on every result in real time

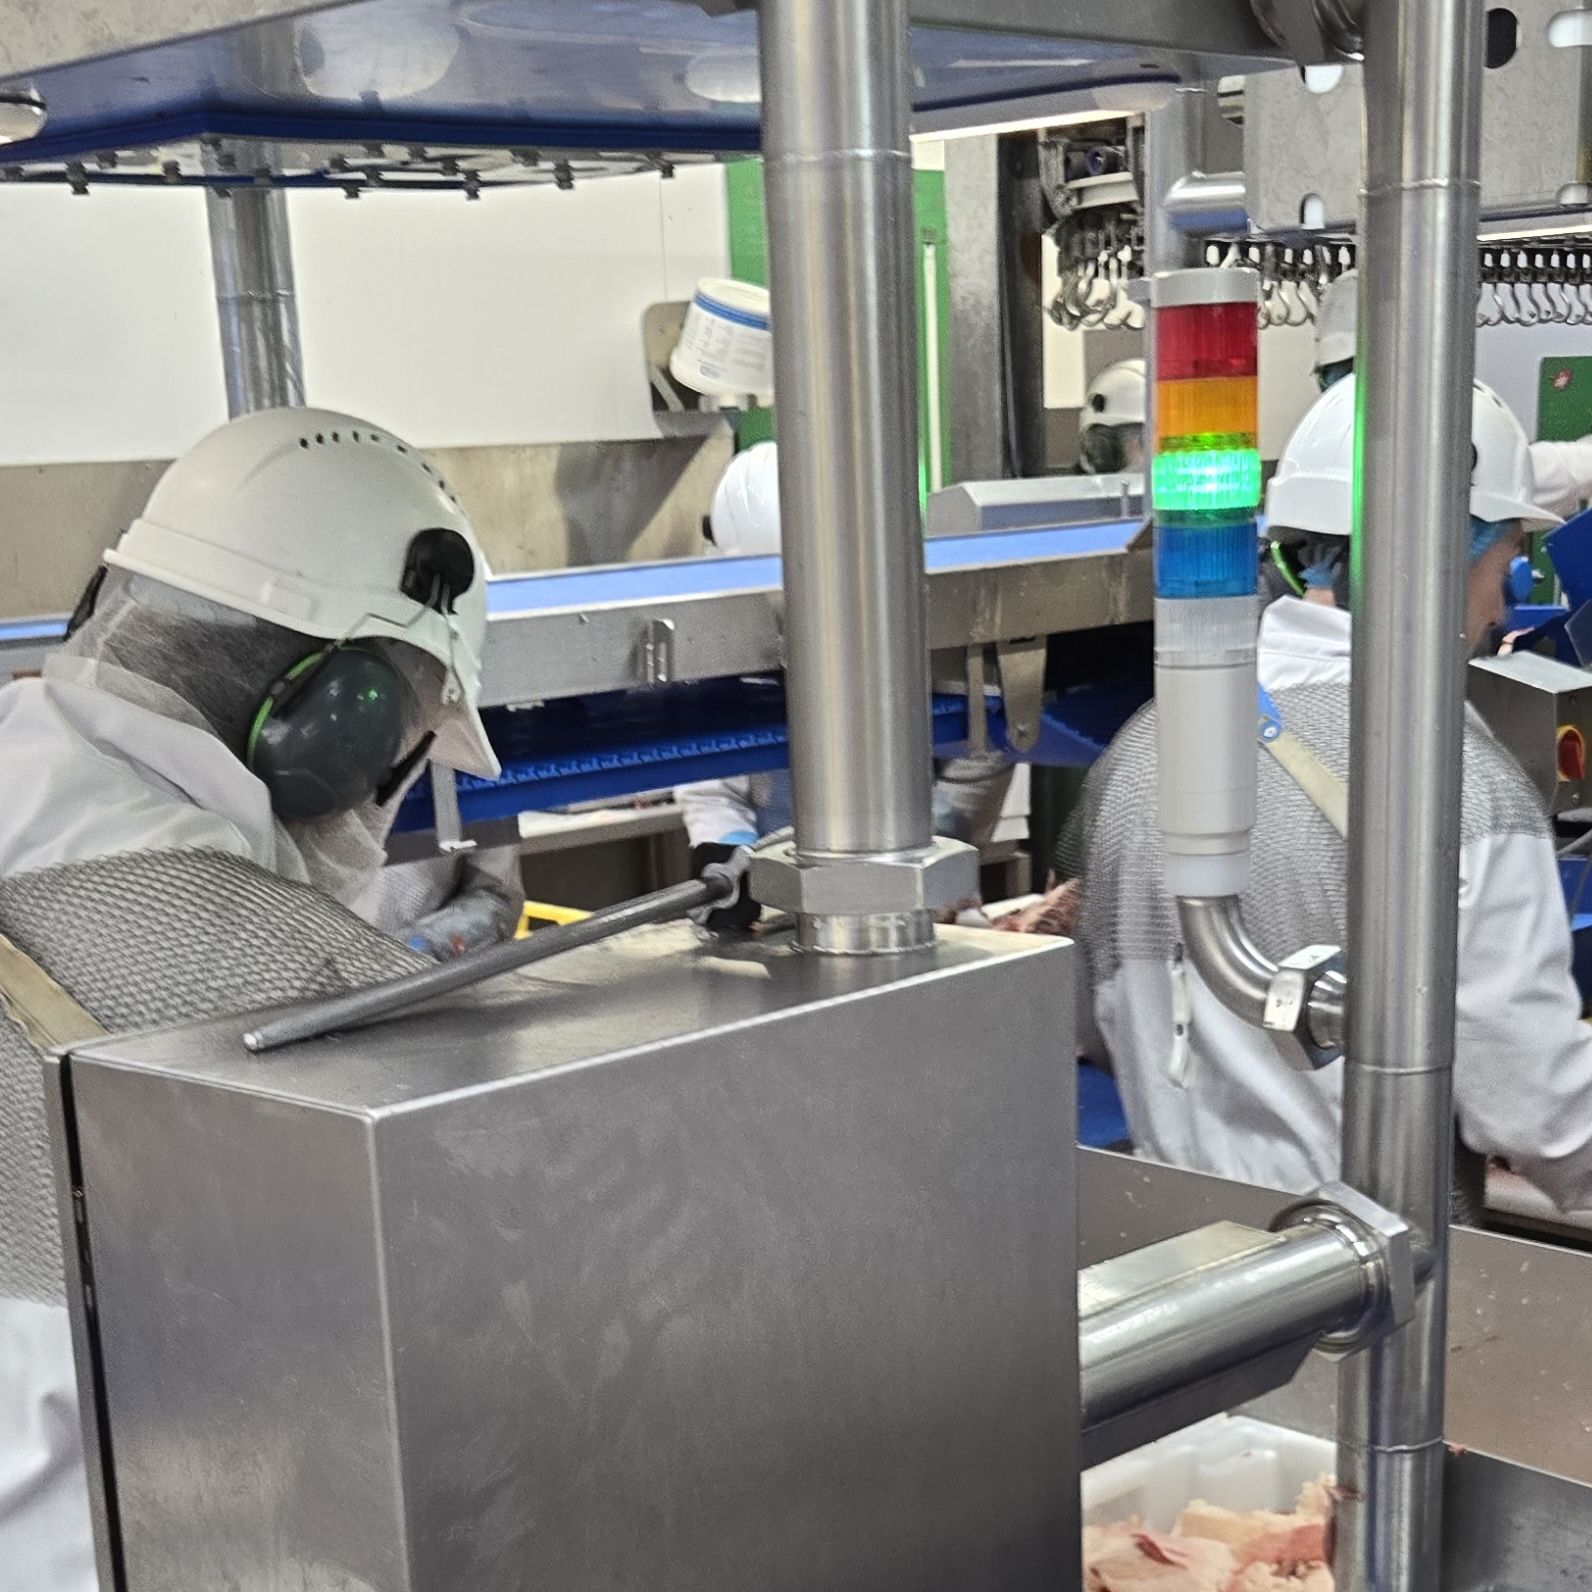
FloVision signals the line in real time — alerts to stack lights, HMIs and floor TVs, emails to supervisors, or auto-reject at the diverter. You set the policy; we enforce it.

FloVision enterprise analytics dashboard rolling up yield and defect rates across sites
Control

See across every site

Yield, giveaway, throughput, and defect rates roll up by line, shift, SKU, and supplier — from a single station to an enterprise dashboard that spans every site. Results flow into your systems through our API, so the numbers live where your teams already work, with a full audit trail behind every one.

Our products

Measure every product. Guide every cut.

Nano measures every product as it runs your conveyors. Pro guides operators cut by cut at the station. Most plants run both.

FloVision Nano analytics dashboard showing line-level yield, giveaway and QA on a poultry conveyor

FloVision Nano

For conveyor systems

Mounted over your conveyors, Nano measures every product on the line — so you see yield and giveaway on every unit, catch defects and foreign bodies, and benchmark performance across every line, shift, and site.

Explore FloVision Nano
FloVision Pro operator dashboard showing real-time feature measurements and guidance at a processing station

FloVision Pro

For processing stations

Mounted over manual stations, Pro measures every cut and guides operators in real time — laser guides show the target cut, and managers get yield, quality, and staff-skill analytics down to the individual operator.

Explore FloVision Pro
Let’s talk

Book a discovery call.
Or skip ahead and see your ROI.

Book 30 minutes and we'll map one line and walk you through exactly what we'd find on your floor. Most processors see payback in about three months — bring your current yield numbers and we'll show you where the giveaway is.

10×
Typical ROI
3 months
Payback period
6 weeks
Pilot to production